
Ask which NFL division is the best and you get two answers, both fair, and they can flatly contradict each other. It comes down to one thing: whether you are measuring what already happened, or guessing what happens next.
This also then has another added layer to it. You will find fans like me making, what I like to call “educated guesses” or you have the experts, like ESPN Stats analysts, forecasters and sports betting traders, whose job it is to price it, trying to predict it.
I only noticed this because two graphics did the rounds this summer, both ranking the divisions, both confident, and they didn’t match. One added up last season’s results. The other forecast the season to come. Neither is wrong. They are answering different questions.
Which division do you think will have the best record this season? pic.twitter.com/QMXf2bqbj4
— FOX Sports: NFL (@NFLonFOX) August 10, 2026
NFL Ranking method 1: measure add up every team’s record
The FOX graphic does the simplest thing possible. It takes all four teams in a division, adds their win-loss records together, and ranks the eight divisions by the total.
Every team plays 17 games, and every division has four teams, so each division’s combined record covers 68 games. The number in brackets is the win percentage: wins divided by games, where .500 is exactly half. (If you want the full picture of how a season is built, that 17-game structure is where the 68 comes from.)
You will spot the odd stray “1”, like the NFC East’s 27-40-1. That is a tie (a drawn game). American football lets a game finish level after a period of overtime, and a tie counts as half a win in the percentage, which is why the NFC North’s 38-29-1 comes out at .566 rather than .559.
By this measure, last season’s strongest division was the NFC West and the weakest was the NFC East.
| Division | 2025 combined record | Win % |
|---|---|---|
| NFC West | 41-27 | .603 |
| NFC North | 38-29-1 | .566 |
| AFC East | 36-32 | .529 |
| AFC South | 36-32 | .529 |
| AFC West | 34-34 | .500 |
| NFC South | 30-38 | .441 |
| AFC North | 29-39 | .426 |
| NFC East | 27-40-1 | .404 |
Source: FOX Sports, 2025 final combined records.
The combined record is a scoreboard: it tells you, precisely, who was strong last season.
What that number quietly hides
A combined record can flatter a division that is really just two good teams and two bad ones.
Look at the AFC East. Its .529 looks healthy. But that total was mostly the Bills and the Patriots beating up on the Dolphins and the Jets. A division can post a tidy number while being wildly lopsided, and the record alone will never tell you that.
Notice, too, that FOX paired the graphic with a forward question: which division will have the best record this coming season. That is precisely where the two ways of looking part company.
A good combined record tells you a division was strong. It doesn’t tell you the strength was shared, or that it will last.
NFL Ranking method 2: forecast who wins
The other approach ignores last season’s totals and asks a forward question instead: who is going to win each division this year?
ESPN’s Football Power Index (FPI), a prediction model, puts a percentage on it. It simulates the season many times over and reports how often each team finishes top of its division. The graphic below is that model’s read on 2026.
NFL Teams ranked by chance to win division
by u/MasterTeacher123 in NFLv2
Looking down the favourites and you learn something the record can’t show: how open each division is. A high favourite means a near-lock. A low one means a genuine scrap.
| Division | Model favourite | Chance to win the division |
|---|---|---|
| AFC East | Bills | 67.6% |
| AFC North | Ravens | 54.2% |
| NFC West | Rams | 46.0% |
| NFC East | Eagles | 44.5% |
| NFC South | Buccaneers | 41.2% |
| AFC South | Texans | 39.7% |
| NFC North | Lions | 38.2% |
| AFC West | Chiefs | 38.2% |
Source: ESPN Football Power Index, as shared on r/NFLv2.
The lower the favourite’s number, the closer the race, which is why the AFC West, with its top team barely clear of the field, is the one everyone wants to argue about.
The people doing this by hand
Models aren’t the only ones forecasting divisions. Creators do the same job by eye, and their reasoning is worth seeing, because a ranking without a reason is just a list.
On Variety Sports Network’s Gridiron Central, two hosts ranked all eight divisions worst to best for 2026. They disagreed on the middle but agreed on the ends: the NFC West at number one, and one of the two southern divisions propping up the table (the standings). Their case for the NFC West was depth, with the reigning champion Seahawks, the 49ers and the Rams all treated as contenders. Their knock on the AFC East was the same lopsidedness the record hides: two good teams, two they expect to struggle.
Bleacher Report’s Kristopher Knox reached a similar bottom by a different route. He scored each division on last season’s results, offseason moves and where each team sat in B/R’s power rankings, then landed on the NFC South as the league’s weakest for 2026, with the NFC North second best.
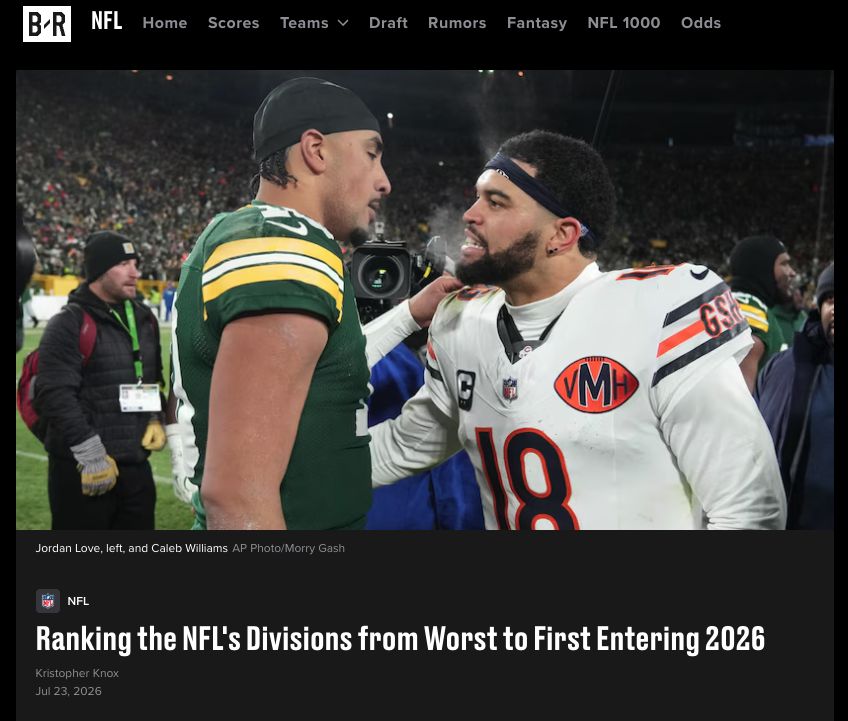
Bleacher Report, “Ranking the NFL’s Divisions from Worst to First Entering 2026″, Kristopher Knox, writer. Image credit to AP Photo/Morry Gash.
Two methods, model and human, broadly agreeing: strong at the top in the NFC West, thin at the bottom in the South.
Why the two measures disagree
They disagree because rosters don’t stand still.
Between February and September a division can lose its best players or add them, through trades, the draft, injuries and new coaching. So a division that dominated last season can slide, and a weak one can climb.
You can see it in the tables above. The AFC South and AFC East both posted respectable 2025 records, yet sit mid-to-low in the 2026 forecasts. The NFC West tops both, which is why it is the safe answer to “best division” this year. The record scores the past; the forecast bets on the future; only rarely do the two line up cleanly.
One measure is settled history, the other an educated guess, and treating them as the same thing is the mistake.
Even the forecasts get argued with
A model’s percentage isn’t a verdict. It is the start of an argument, and fans treat it exactly that way.
Under the FPI graphic on r/NFLv2, the AFC West set people off. One asked why the Broncos were rated so low. Another insisted the Chiefs were too high, third at best. Then a reply laid out the actual case for the model: Kansas City is expected to rebound, the Chargers brought in a sharp new offensive coordinator, and the Chiefs won a stack of close games last year while facing a tougher schedule this time.
That back-and-forth is the point. Reasonable people read the same roster and disagree.

Source:https://www.reddit.com/r/NFLv2/comments/1v3w0wj/nfl_teams_ranked_by_chance_to_win_division/ thread under the r/NFLv2 FPI post (replies from ForgotMyRemembrall, Football_8545, allthenamesaretaken4 and others).
If a projection makes you want to argue, it is doing its job.
Which NFL Ranking Method should you use?
Use the combined record when you want to know who actually was strong last season. It is factual and settled, a scoreboard.
Use the forecasts when you want to know who to watch this season, but hold them as opinions with reasons attached, not as facts. A model’s percentage and a creator’s ranking are both arguments, and the reasons matter more than the order they land in. Both ultimately point the same way: toward who takes each division and how the playoff seeding falls out.
The one thing to avoid is mixing them up. A great record last year does not promise a great division next year, and a 46% chance is not a plane ticket to January.
So next time a “best division” graphic slides past you, check one thing before you trust it: is it scoring the season that finished, or predicting the one that hasn’t started? That single question tells you what the number is actually worth.
I will be sharing my own NFL Division Rankings shortly, based on a combination of the two methods above. Link to post coming soon!