In 2021 the NFL added a 17th regular-season game to settle a labour deal and clear the way for a record television contract, not to give fans more football. The league had played 16 games a season since 1978, but according to ESPN’s Kevin Seifert, NFL owners had been pushing to expand for the best part of a decade.
The extra game was a bargaining chip in the 2020 collective bargaining agreement (the CBA, the contract between the league and the players’ union that sets pay and conditions).
A longer season was the by-product. The players got a slightly bigger share of the money, the owners got more to sell, and the audience got a story about being given more football.
What people say Game 17 was for
The version you hear most is that the league added a game because fans wanted more of it. The NFL did not discourage that view. When the deal passed, Commissioner Roger Goodell welcomed a season that would give supporters “more and better football.”
More games sounds like a favour to the audience, and the audience was not going to argue.
The trouble is that a favour to fans would not have taken ten years of negotiation and a near-tied vote to arrive. Something that simple does not get fought over that hard.
The CBA & Players Union Vote 2020
In March 2020, the players’ union voted to accept a new CBA by 1,019 to 959. That is a margin of 60 from nearly 2,000 ballots. Thirty-odd players changing their minds would have sunk it.
It was not an easy or comfortable yes. The union’s own executive committee had recommended against the deal, and stars like Aaron Rodgers and J.J. Watt argued publicly to reject it.
Buried in the terms was the thing the owners had chased for years: the option, from 2021, to make the regular season 17 games.
What the two sides really traded
Underneath the language, the CBA was a swap. The owners got a longer season and an extra playoff game; the players got money and better conditions. The moving parts:
What changed
Before
After the CBA
Regular-season games
16
17 (from 2021)
Preseason games
4
3
Players’ share of revenue
47%
48.5%, up to 48.8% via TV kicker
Playoff teams
12
14
Notice the 17th game did not add a fresh week of football out of nowhere. It replaced the fourth preseason game, the warm-up matches that do not count, so players were swapping a low-stakes exhibition for a real one.
The revenue line is where the intent shows. The players’ base share rose from 47% to 48% from 2021, with a built-in climb toward 48.5% (and as high as 48.8%) that triggers as the new TV money lands, not as the football does. Players under contract when the deal was signed were also handed a bonus worth one seventeenth of their salary in any 17-game year. The extra pay was wired to the extra broadcasting, not the extra game.
The BIG prize, a record $110B TV deal
A year later, the real motive arrived. The NFL signed new television deals worth more than $110 billion, the richest in the history of sport. They run for eleven years, began in 2023, and roughly doubled what the networks had been paying.
A 17-game season is more to broadcast: another Sunday window, one more marquee fixture per team, a fuller slate to auction off. The extra game and the mega-deal are the same decision, taken twelve months apart.
Why the “more football” story stuck
The fan-demand line survives because it is the flattering one. “We gave you another game” reads better than “we negotiated a longer, more punishing season in exchange for a bigger cheque on both sides.”
There is a real tension under it, and it is worth naming rather than smoothing over. The players carry the physical cost of a 17th game; the owners and the union pocketed the financial upside. People inside the sport genuinely disagreed about whether that was a fair trade, which is why it came down to sixty votes.
The mark it left on the record book
The extra game turns up every season in one place. When a quarterback throws for the most yards in a year, or a receiver catches the most touchdowns, that total now comes from 17 games where the older records came from 16. Line up the eras and you are not always comparing like with like. A labour negotiation quietly moved the record book, and it did it for reasons that had nothing to do with the players in the record book.
What did it change for us the fans
The 17-game season is not a scheduling quirk. It is the visible edge of a business decision, and once you can see that, more of the modern NFL falls into place: the international fixtures and the push onto streaming are the same instinct, which is to turn football into more inventory to sell.
The season you watch was shaped in a conference room in 2020, by a vote that could easily have gone the other way. For how the 18-week, 17-game calendar actually fits together, I have set it out in how the NFL season is structured. The same deal reshaped the playoffs, which I cover in the expanded 14-team postseason.
As I promised at the end of my last post, Which NFL division is best, I’ve put together my own picks for who wins all eight divisions this season, with the reasoning behind each one.
This is a first for me, so I’d genuinely love to know what you make of the method, but more importantly the picks. I’m a new fan, I support the Raiders (I know, I know), and I’m learning this as I go.
So rather than pretend I’m a super fan and statistical genius, I took three sources I’ve come to trust, worked out where they agree and where they fall out, and then made my own calls.
When the experts fumble
As I started out looking into how best to approach this I discovered that last season the experts had a shocker.
ESPN’s preseason Super Bowl favourite, the Eagles, never even reached the Super Bowl. The Football Power Index’s No. 1 ranked team, the Ravens, missed the playoffs entirely. And of the eight teams the market and the models made preseason favourites to win their division, exactly one actually did it.
They got ONE out of eight. So when a first-timer tells you she fancies a couple of underdogs, remember the professionals went 1-for-8 last year. My gut currently is not any worse than their data machines and insight – just yet.
The method behind my NFL Division picks
I reviewed three different approaches, before I made my choices (guesses).
ESPN’s FPI is a model. It runs the season thousands of times and gives each team a percentage chance of winning its division, so it’s cold, mathematical, and honest about uncertainty.
FanDuel is the money. Their win totals show where the betting market is leaning, which is a different kind of wisdom, the crowd voting with its wallet. And Bleacher Report is a human analyst going game by game, weighing the stuff a model can’t, like a rookie quarterback or a coaching change.
Where all three agreed, I mostly followed. Where they split, or where ESPN’s own numbers showed a live second-place team, I trusted my read. Here’s the full board, with my pick in the last column.
Division
ESPN FPI
FanDuel
Bleacher Report
My pick
AFC East
Bills (67.6%)
Bills
Bills
Bills
AFC North
Ravens (54.2%)
Ravens
Ravens
Ravens
NFC West
Rams (46.0%)
Rams
Rams
Seahawks
NFC East
Eagles (44.5%)
Eagles
Cowboys
Cowboys
NFC South
Buccaneers (41.2%)
Buccaneers
Saints
Buccaneers
AFC South
Texans (39.7%)
Texans
Texans
Jaguars
NFC North
Lions (38.2%)
Lions
Lions
Packers
AFC West
Chiefs (38.2%)
Broncos
Broncos
Broncos
FPI figures are each favourite’s chance to win the division. FanDuel odds reflect the market as of May 2026 and potentially may have already moved.
The ones I didn’t argue with the experts
Two divisions weren’t worth being clever about. The Bills (AFC East) and the Ravens (AFC North) are the pick of all three sources, and comfortably so, with ESPN giving them 67.6% and 54.2%. When the model, the market and the analyst all agree by that margin, being contrarian is just showing off.
I also sided with the majority on two more. In the AFC West I’ve got the Broncos, which is interesting because this is the one place I’ve gone against ESPN, not with it. FPI still has the Chiefs top of the division, but that model is leaning on Kansas City’s name after they collapsed to 6-11 last year. FanDuel and Bleacher Report both back Denver, the reigning division champions, and so do I. And in the NFC South I’ve kept the Buccaneers, siding with ESPN and FanDuel over B/R’s call of a Saints upset.
The ones where I broke from the pack
This is the fun part, and it’s where I’d most like your verdict.
NFC West: I’m taking the Seahawks over the Rams. Every source has the Rams, but Seattle are the reigning Super Bowl champions, and ESPN’s own model still gives them a 27.8% shot at the division. Backing the defending champs to win their own division is hardly a wild swing. It’s my heart pick, but the numbers don’t laugh at me for it.
AFC South: I’m taking the Jaguars over the Texans. This is the one I’m most confident is defensible. Jacksonville won this division at 13-4 last year, and FPI has them at 34.9% against Houston’s 39.7%. That’s almost a coin flip. Reigning champions who the model rates as a near-equal are worth backing.
NFC North: I’m taking the Packers over the Lions. Detroit are the favourites, but only just, and FPI has Green Bay right behind them at 32.8%. With a healthy roster I think the value is on the Packers, and the model doesn’t think I’m mad.
NFC East: I’m taking the Cowboys over the Eagles. Here I’m not even alone. Bleacher Report picks Dallas outright, on the back of their rebuilt defence, and I agree the swing in that division is on whether that overhaul lands. ESPN and FanDuel still have Philadelphia, so this is a genuine split, and I’ve come down on the Dallas side of it.
The thread running through those four: I only strayed where a respected source was already there with me, or where ESPN’s own index showed the runner-up within touching distance. I’m not claiming to know more than the model. I’m choosing which of its close calls to believe.
And then there are my Raiders
I support the Raiders, so let’s be honest about where they sit. Last season they went 3-14, finished bottom of the AFC West, and tied for the worst record in the entire league, which at least handed them the No. 1 pick. All three sources have them rooted to the foot of the division again this year.
So I’m not picking them to win anything. I’m just here for the climb. There’s a new coach in. Klint Kubiak, a rookie quarterback waiting in the wings – Fernando Mendoza, and a genuine rebuild underway. This year, the only way is up. But feel free to ask me come January.
Now it’s over to you. Tell me where I’ve got it wrong, tell me which underdog you’re backing, and come back at the end of the season so we can see how badly the new fan did against the professionals. I suspect I’ll have earned a bit of stick either way.
Sources and methodology
Here’s exactly where each number comes from and how each source builds it, so you can dig into the data yourself. It’s worth knowing these three aren’t measuring the same thing: one is a model, one is a betting market, and one is a person.
ESPN Football Power Index (FPI) — a prediction model. FPI rates every team, then simulates the full season many thousands of times. The percentage I’ve used for each division is the share of those simulated seasons in which that team finishes top of its division, so it’s a probability, not a verdict. Forward-looking and cold-blooded about uncertainty. The 2026 division figures were shared publicly on r/NFLv2; for how FPI itself is built, ESPN publishes its own explainer.
Here’s the full board I worked from, every team’s FPI chance of winning its division:
FanDuel Sportsbook — the betting market. FanDuel sets a regular-season win total for each team, and bettors take the over or the under; the attached price (for example, a Bills over at -130) tells you which way the money is leaning and how strongly. Where a book quotes them, division-winner odds price each team’s implied chance directly. So this column is the crowd voting with its wallet, not an editorial opinion. The numbers I used are from FanDuel’s schedule-and-win-totals research, reflecting the market as of May 2026, and odds move. 21+. Gambling problem? Call 1-800-GAMBLER.
Bleacher Report — a human analyst. In his predicted 2026 standings, Moe Moton projects a win-loss record for all 32 teams, weighing offseason moves, training-camp news, injuries, coaching changes and the strength of each schedule, then orders every division and names his winners. This is judgement, not maths: the stuff a model struggles to price, like a rookie quarterback or a new defensive coordinator, is exactly what a person can weigh.
Last season’s actual results come from Pro Football Reference, which is the source for every “here’s how the experts did in 2025” claim above.
The numbers behind my NFL division picks
For anyone who wants to check the “the professionals went 1-for-8” line, here’s the 2025 preseason favourite against who actually won each division.
Division
2025 preseason favourite
Actual winner
AFC East
Bills
Patriots
AFC North
Ravens
Steelers
AFC South
Texans
Jaguars
AFC West
Chiefs
Broncos
NFC East
Eagles
Eagles
NFC North
Lions
Bears
NFC South
Buccaneers
Panthers
NFC West
Rams / 49ers
Seahawks
Only the Eagles held serve. Everything else went to a team that wasn’t the favourite, which is the whole reason a first-timer felt brave enough to file her own picks.
Ask which NFL division is the best and you get two answers, both fair, and they can flatly contradict each other. It comes down to one thing: whether you are measuring what already happened, or guessing what happens next.
This also then has another added layer to it. You will find fans like me making, what I like to call “educated guesses” or you have the experts, like ESPN Stats analysts, forecasters and sports betting traders, whose job it is to price it, trying to predict it.
I only noticed this because two graphics did the rounds this summer, both ranking the divisions, both confident, and they didn’t match. One added up last season’s results. The other forecast the season to come. Neither is wrong. They are answering different questions.
NFL Ranking method 1: measure add up every team’s record
The FOX graphic does the simplest thing possible. It takes all four teams in a division, adds their win-loss records together, and ranks the eight divisions by the total.
Every team plays 17 games, and every division has four teams, so each division’s combined record covers 68 games. The number in brackets is the win percentage: wins divided by games, where .500 is exactly half. (If you want the full picture of how a season is built, that 17-game structure is where the 68 comes from.)
You will spot the odd stray “1”, like the NFC East’s 27-40-1. That is a tie (a drawn game). American football lets a game finish level after a period of overtime, and a tie counts as half a win in the percentage, which is why the NFC North’s 38-29-1 comes out at .566 rather than .559.
By this measure, last season’s strongest division was the NFC West and the weakest was the NFC East.
Division
2025 combined record
Win %
NFC West
41-27
.603
NFC North
38-29-1
.566
AFC East
36-32
.529
AFC South
36-32
.529
AFC West
34-34
.500
NFC South
30-38
.441
AFC North
29-39
.426
NFC East
27-40-1
.404
Source: FOX Sports, 2025 final combined records.
The combined record is a scoreboard: it tells you, precisely, who was strong last season.
What that number quietly hides
A combined record can flatter a division that is really just two good teams and two bad ones.
Look at the AFC East. Its .529 looks healthy. But that total was mostly the Bills and the Patriots beating up on the Dolphins and the Jets. A division can post a tidy number while being wildly lopsided, and the record alone will never tell you that.
Notice, too, that FOX paired the graphic with a forward question: which division will have the best record this coming season. That is precisely where the two ways of looking part company.
A good combined record tells you a division was strong. It doesn’t tell you the strength was shared, or that it will last.
NFL Ranking method 2: forecast who wins
The other approach ignores last season’s totals and asks a forward question instead: who is going to win each division this year?
ESPN’s Football Power Index (FPI), a prediction model, puts a percentage on it. It simulates the season many times over and reports how often each team finishes top of its division. The graphic below is that model’s read on 2026.
Looking down the favourites and you learn something the record can’t show: how open each division is. A high favourite means a near-lock. A low one means a genuine scrap.
Division
Model favourite
Chance to win the division
AFC East
Bills
67.6%
AFC North
Ravens
54.2%
NFC West
Rams
46.0%
NFC East
Eagles
44.5%
NFC South
Buccaneers
41.2%
AFC South
Texans
39.7%
NFC North
Lions
38.2%
AFC West
Chiefs
38.2%
Source: ESPN Football Power Index, as shared on r/NFLv2.
The lower the favourite’s number, the closer the race, which is why the AFC West, with its top team barely clear of the field, is the one everyone wants to argue about.
The people doing this by hand
Models aren’t the only ones forecasting divisions. Creators do the same job by eye, and their reasoning is worth seeing, because a ranking without a reason is just a list.
On Variety Sports Network’s Gridiron Central, two hosts ranked all eight divisions worst to best for 2026. They disagreed on the middle but agreed on the ends: the NFC West at number one, and one of the two southern divisions propping up the table (the standings). Their case for the NFC West was depth, with the reigning champion Seahawks, the 49ers and the Rams all treated as contenders. Their knock on the AFC East was the same lopsidedness the record hides: two good teams, two they expect to struggle.
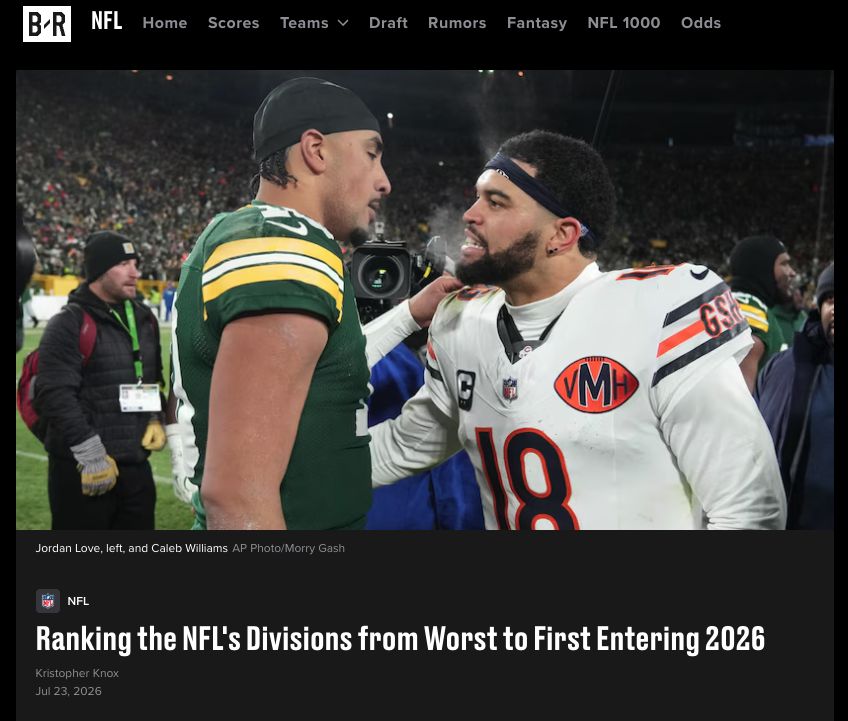
Bleacher Report’s Kristopher Knox reached a similar bottom by a different route. He scored each division on last season’s results, offseason moves and where each team sat in B/R’s power rankings, then landed on the NFC South as the league’s weakest for 2026, with the NFC North second best.
Two methods, model and human, broadly agreeing: strong at the top in the NFC West, thin at the bottom in the South.
Why the two measures disagree
They disagree because rosters don’t stand still.
Between February and September a division can lose its best players or add them, through trades, the draft, injuries and new coaching. So a division that dominated last season can slide, and a weak one can climb.
You can see it in the tables above. The AFC South and AFC East both posted respectable 2025 records, yet sit mid-to-low in the 2026 forecasts. The NFC West tops both, which is why it is the safe answer to “best division” this year. The record scores the past; the forecast bets on the future; only rarely do the two line up cleanly.
One measure is settled history, the other an educated guess, and treating them as the same thing is the mistake.
Even the forecasts get argued with
A model’s percentage isn’t a verdict. It is the start of an argument, and fans treat it exactly that way.
Under the FPI graphic on r/NFLv2, the AFC West set people off. One asked why the Broncos were rated so low. Another insisted the Chiefs were too high, third at best. Then a reply laid out the actual case for the model: Kansas City is expected to rebound, the Chargers brought in a sharp new offensive coordinator, and the Chiefs won a stack of close games last year while facing a tougher schedule this time.
That back-and-forth is the point. Reasonable people read the same roster and disagree.
Source:https://www.reddit.com/r/NFLv2/comments/1v3w0wj/nfl_teams_ranked_by_chance_to_win_division/ thread under the r/NFLv2 FPI post (replies from ForgotMyRemembrall, Football_8545, allthenamesaretaken4 and others).
If a projection makes you want to argue, it is doing its job.
Which NFL Ranking Method should you use?
Use the combined record when you want to know who actually was strong last season. It is factual and settled, a scoreboard.
Use the forecasts when you want to know who to watch this season, but hold them as opinions with reasons attached, not as facts. A model’s percentage and a creator’s ranking are both arguments, and the reasons matter more than the order they land in. Both ultimately point the same way: toward who takes each division and how the playoff seeding falls out.
The one thing to avoid is mixing them up. A great record last year does not promise a great division next year, and a 46% chance is not a plane ticket to January.
So next time a “best division” graphic slides past you, check one thing before you trust it: is it scoring the season that finished, or predicting the one that hasn’t started? That single question tells you what the number is actually worth.
I will be sharing my own NFL Division Rankings shortly, based on a combination of the two methods above. Link to post coming soon!
Six. That is how many games a season an NFL team plays against the same three opponents, for as long as both clubs exist. It is built into the schedule.
Guaranteed. No relegation, so a rival can never drop out of your way. There is always a next one. There is no escape.
Every sport has great rivalries. These ones are compulsory.
What the six games actually are
The league’s 32 clubs sit in eight divisions of four. Your division is your neighbourhood, and it never changes.
You play each of those three rivals twice, home and away. Six games, decided in advance rather than by a draw.
The other eleven rotate. These six never do.
Why that is more than it sounds
Six out of seventeen games is a big share of a short season. Roughly a third of the year, every year, against clubs you have history with.
Compare that to football. In a 38-game Premier League season you meet your biggest rival twice, which is about one game in nineteen. In the NFL it is closer to one in three.
So an NFL rivalry gets roughly seven times the share of the calendar.
It adds up faster than you would think
Do that for a century and the numbers get silly.
I have written up five of these rivalries in full, and between them those five pairs of clubs have played each over 600 times. The Bears and the Packers alone account for 213 of those, which makes it the most-played fixture in the sport.
Here is what each of the five is actually about.
Bears v Packers: the club owned by its fans
Chicago and Green Bay, either side of the Illinois and Wisconsin border. They first met in 1921 and have now played 213 times, more than any other pair of clubs in the sport.
Green Bay is the strange one. Every other club in the league has an owner or an owning family. The Packers have no owner at all, which makes them the only community-owned, non-profit club in American major professional sports. There are more Packers shareholders than there are people in the Green Bay metro area.
On the field it has been a see-saw for a century. The lead has changed hands again and again, and after 213 games it is still narrow.
Read it in full:Bears v Packers, including the third playoff meeting in their history, which happened in January.
Cowboys v Eagles: America’s Team and the city that hates the phrase
Dallas and Philadelphia sit about 1,300 miles apart with nothing local to argue about. What they have instead is a nickname.
An NFL film gave the Cowboys the tag “America’s Team” in 1978 and it stuck. In a proud, blue-collar city like Philadelphia, a glamorous Texas club branding itself the nation’s team was never going to land well. Philadelphia is also one of the hardest places in the sport to visit: in 1989 the crowd threw snowballs and ice at the Dallas coach as police walked him off the field.
The record says Dallas lead comfortably, 75-59. The decade data says they built almost all of it in the 1970s, and it has been near enough level ever since.
Readabout the Cowboys v Eagles rivalry, including the Bounty Bowl and what actually happened.
Steelers v Ravens: two clubs built to hurt each other
Pittsburgh and Baltimore, 250 miles apart, both built around punishing defensive football. The scorelines are low, the hits are enormous, and the games are ugly in the way both sets of supporters mean as a compliment.
It is the youngest of the five. Baltimore only got this club in 1996, and the Ravens still tell every new arrival the same thing: you are not a Raven until you have beaten the Steelers.
Here is the number that captures it. Across 65 meetings, the two clubs are separated by 33 points in total. That is half a point a game, over thirty years.
Read about the Steelers v Ravens rivalry, including the meeting in January that cost a coach his job of eighteen years.
Chiefs v Raiders: the loudest crowd ever recorded
Kansas City and Las Vegas now, but this one goes back to 1960, when both clubs were founder members of a rival league trying to take on the NFL. They have been in the same division ever since.
Arrowhead Stadium in Kansas City holds the Guinness World Record for the loudest crowd roar at a sports stadium: 142.2 decibels, set in 2014. Chiefs supporters first took that record off Seattle a year earlier, during a game against the Raiders.
The Raiders bring the other half of it. They have spent decades cultivating an outlaw image, and they have moved city three times, from Oakland to Los Angeles to Oakland to Las Vegas. The rivalry survived all of it, because it was never really about the map.
Read about the Chiefs v Raiders rivalry, including how the Raiders’ eleven-game lead turned into a twenty-game deficit.
Patriots v Jets: level for fifty seasons, then one letter
Boston and New York, which means this one arrives with a grudge already attached. These cities have been arguing about sport since long before either football club existed, and the fans borrow freely from the baseball version.
The genuinely odd part is how much traffic there has been between the two organisations. Three men have coached both clubs. More than fifty players turned out for both between 1993 and 2008. Rivals do not usually swap this much.
And it stayed astonishingly even. After fifty seasons the series stood at fifty wins each. Then, in January 2000, a coach handed the Jets a handwritten note resigning the job he had held for one day, and went to New England.
Read the fullPatriots v Jets rivalry, including what the record has done since.
If you are still choosing a club, the NFL teams hub has all 32 of them and what each has actually won. Whichever you land on, you inherit its enemies. That is part of the deal, and honestly it is part of the fun of being a fan.
Tampa Bay were top of the NFC South when they went to bed on Saturday 3 January. By the Sunday afternoon they were out of the playoffs, and they had not played again.
That was the final weekend of the 2025 season. No result involving Tampa Bay changed across those two days. Their record didn’t change. What changed was how many teams were tied with them, and that decided everything.
Here’s why, because the mechanism is stranger than the headlines suggested at the time.
What actually happened
On Saturday 3 January 2026, Tampa Bay beat Carolina 16-14 at home, in heavy rain. Both finished 8-9.
That left two teams tied at the top of the NFC South, and the two-team tiebreakers favoured Tampa Bay. As of Saturday night they led the division. They hadn’t won it yet, though: they needed New Orleans to beat or draw with Atlanta the following day. A fifth straight division title was riding on a game they weren’t in.
Then on Sunday 4 January, the last day of the regular season, Atlanta beat New Orleans 19-17. Atlanta had already been eliminated and had nothing to play for. That win took them to 8-9 as well.
Now three teams were tied, not two. The tiebreakers ran again and gave the division to Carolina, their first since 2015.
Team
Record
Result
Carolina Panthers
8-9
Won the division, hosted a playoff game
Tampa Bay Buccaneers
8-9
Missed the playoffs
Atlanta Falcons
8-9
Missed the playoffs
The short version: Atlanta didn’t beat Carolina or Tampa Bay that weekend. They just joined the tie, and joining it was enough.
The two wins that were worth nothing, then everything
This is the bit that explains it, and it’s simpler than it sounds.
When two teams are tied, “head-to-head” means only the games those two played against each other. Carolina and Tampa Bay had split their two meetings, one win each. No separation, so the tiebreakers moved on.
But Carolina had also beaten Atlanta. Twice.
While the tie was just Carolina against Tampa Bay, those two wins counted for nothing. Atlanta weren’t in the tie, so games against Atlanta weren’t head-to-head games.
The moment Atlanta joined, “head-to-head” meant all the games among all three teams. Carolina’s two wins over Atlanta went from irrelevant to decisive.
Team
Record against the other two tied teams
Carolina
3-1
Tampa Bay
2-2
Atlanta
1-3
Carolina had banked an advantage that only existed if Atlanta were in the tie. Atlanta put themselves in it.
What the rulebook actually says
The NFL publishes its tie-breaking procedures in full, and the answer is there in black and white. There are two separate lists for teams in the same division, and they don’t start the same way.
For two clubs, the order runs: head-to-head record, then record within the division, then record in common games.
Carolina and Tampa Bay were 1-1 head-to-head. Both were 3-3 within the division. So it came down to common games, where Tampa Bay were ahead. Tampa Bay won.
For three or more clubs, the first step is head-to-head measured as the combined record among all the tied teams.
Carolina were 3-1. That settled it at the first step. Nothing else was needed.
Same season, same results, two different first questions. That’s the whole explanation.
Worth saying plainly: it took me two attempts to get this right. The rulebook also has a three-club procedure for wild card places, and that one opens with a “head-to-head sweep” that only applies if a team beat all the others or lost to all of them. Grab the wrong list and you get the wrong answer. They sit close together and they aren’t interchangeable.
Why this isn’t a mistake in the rules
It looks like a loophole. It isn’t.
The rule is trying to reward teams who beat the teams they finished level with. In a two-way tie that’s a clean comparison: you played each other twice, who won more.
In a three-way tie there’s no clean pairwise answer, so the league uses the combined record instead. That’s a sensible measure. It just happens to change which games count.
Adding a team to a tie enlarges the pool of games that count as head-to-head. That’s the whole mechanism, and the strange result falls out of it.
The rule behaved exactly as written. It’s the consequence that’s counterintuitive, not the rulebook.
What the coverage got right, and what it skipped
Every outlet I read reported the outcome correctly. Carolina won the three-way head-to-head at 3-1, and Atlanta’s win created the tie. That’s all accurate.
What almost none of it explained was why the two-way and three-way procedures give opposite answers from identical results. That’s the interesting part, and it’s the part that tells you something you can use again.
If a rule surprises you, the explanation is usually in the document rather than in the coverage of it.
What to watch for next time
Two things, and they’ll both come round again.
Late-season games involving eliminated teams matter more than they look. A team with nothing to play for can’t win a division. It can decide one, by joining a tie and changing which games count.
Your own results aren’t the whole picture. If you’re heading for a tie, your record against the specific teams you might be tied with is what matters, and that includes teams who haven’t finished level with you yet.
Carolina, for what it’s worth, then lost their playoff game at home the following weekend, 34-31 to the Los Angeles Rams. A team four wins better had to travel to play them, which is a different oddity in the same system, and how the NFL playoffs work takes that one apart.
The 2026 season starts on 9 September, and its own final weekend lands in early January. Somewhere in the eight divisions, this will very nearly happen again.
If you want the wider structure this all sits inside, how the NFL works covers the league from thirty-two teams down to the Super Bowl, and the AFC and NFC explained covers why the divisions look the way they do. For the game itself rather than the structure around it, start with the NFL rules guides.
Tampa Bay were top of the NFC South on Saturday night. By Sunday afternoon they were out of the playoffs, and they never played again.
No result involving Tampa Bay changed. Their record didn’t change. What changed was how many teams were tied with them, and that decided everything.
Here’s why, because the mechanism is stranger than the headlines suggested.
What actually happened
On the Saturday of the final weekend, Tampa Bay beat Carolina 16-14 at home, in heavy rain. Both finished 8-9.
That left two teams tied at the top of the NFC South, and the two-team tiebreakers favoured Tampa Bay. As of Saturday night they led the division. They hadn’t won it yet, though: they needed New Orleans to beat or draw with Atlanta the following day. A fifth straight division title was riding on a game they weren’t in.
Then on the Sunday, Atlanta beat New Orleans 19-17. Atlanta had already been eliminated and had nothing to play for. That win took them to 8-9 as well.
Now three teams were tied, not two. The tiebreakers ran again and gave the division to Carolina, their first since 2015.
Team
Record
Result
Carolina Panthers
8-9
Won the division, hosted a playoff game
Tampa Bay Buccaneers
8-9
Missed the playoffs
Atlanta Falcons
8-9
Missed the playoffs
The short version: Atlanta didn’t beat Carolina or Tampa Bay that weekend. They just joined the tie, and joining it was enough.
The two wins that were worth nothing, then everything
This is the bit that explains it, and it’s simpler than it sounds.
When two teams are tied, “head-to-head” means only the games those two played against each other. Carolina and Tampa Bay had split their two meetings, one win each. No separation, so the tiebreakers moved on.
But Carolina had also beaten Atlanta. Twice.
While the tie was just Carolina against Tampa Bay, those two wins counted for nothing. Atlanta weren’t in the tie, so games against Atlanta weren’t head-to-head games.
The moment Atlanta joined, “head-to-head” meant all the games among all three teams. Carolina’s two wins over Atlanta went from irrelevant to decisive.
Team
Record against the other two tied teams
Carolina
3-1
Tampa Bay
2-2
Atlanta
1-3
Carolina had banked an advantage that only existed if Atlanta were in the tie. Atlanta put themselves in it.
What the rulebook actually says
The NFL publishes its tie-breaking procedures in full, and the answer is there in black and white. There are two separate lists for teams in the same division, and they don’t start the same way.
For two clubs, the order runs: head-to-head record, then record within the division, then record in common games.
Carolina and Tampa Bay were 1-1 head-to-head. Both were 3-3 within the division. So it came down to common games, where Tampa Bay were ahead. Tampa Bay won.
For three or more clubs, the first step is head-to-head measured as the combined record among all the tied teams.
Carolina were 3-1. That settled it at the first step. Nothing else was needed.
Same season, same results, two different first questions. That’s the whole explanation.
Worth saying plainly: it took me two attempts to get this right. The rulebook also has a three-club procedure for wild card places, and that one opens with a “head-to-head sweep” that only applies if a team beat all the others or lost to all of them. Grab the wrong list and you get the wrong answer. They sit close together and they aren’t interchangeable.
Why this isn’t a mistake in the rules
It looks like a loophole. It isn’t.
The rule is trying to reward teams who beat the teams they finished level with. In a two-way tie that’s a clean comparison: you played each other twice, who won more.
In a three-way tie there’s no clean pairwise answer, so the league uses the combined record instead. That’s a sensible measure. It just happens to change which games count.
Adding a team to a tie enlarges the pool of games that count as head-to-head. That’s the whole mechanism, and the strange result falls out of it.
The rule behaved exactly as written. It’s the consequence that’s counterintuitive, not the rulebook.
What the coverage got right, and what it skipped
Every outlet I read reported the outcome correctly. Carolina won the three-way head-to-head at 3-1, and Atlanta’s win created the tie. That’s all accurate.
What almost none of it explained was why the two-way and three-way procedures give opposite answers from identical results. That’s the interesting part, and it’s the part that tells you something you can use again.
If a rule surprises you, the explanation is usually in the document rather than in the coverage of it.
What to watch for next time
Two things, and they’ll both come round again.
Late-season games involving eliminated teams matter more than they look. A team with nothing to play for can’t win a division. It can decide one, by joining a tie and changing which games count.
Your own results aren’t the whole picture. If you’re heading for a tie, your record against the specific teams you might be tied with is what matters, and that includes teams who haven’t finished level with you yet.
Carolina, for what it’s worth, then lost their playoff game at home to the Los Angeles Rams, 34-31. A team four wins better had to travel to play them, which is a different oddity in the same system, and how the NFL playoffs work takes that one apart.
The 2026 season starts on 9 September, and its own final weekend lands in early January. Somewhere in the eight divisions, this will very nearly happen again.
If you want the wider structure this all sits inside, how the NFL works covers the league from thirty-two teams down to the Super Bowl, and the AFC and NFC explained covers why the divisions look the way they do. For the game itself rather than the structure around it, start with the NFL rules guides.